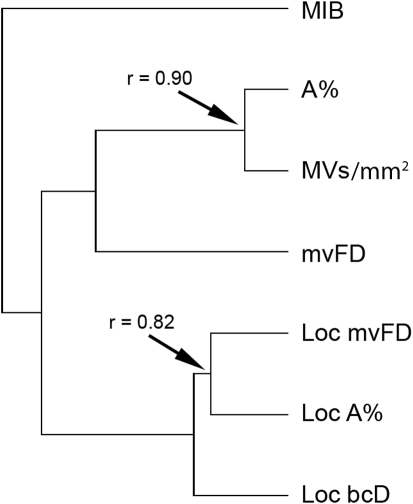
Figure 1. Hierarchical clustering of the angiomorphometric parameters by means of the un-weighted pair group method with arithmetic mean (UPGMA), according to their correlation coefficients (co-phenetic correlation coefficient for the whole set: 0.81).
Variables are clustered according to their degree of correlation. The coefficients of correlation for the most correlated variables are shown as indicative references. (For the list of abbreviations, see Table 1).

