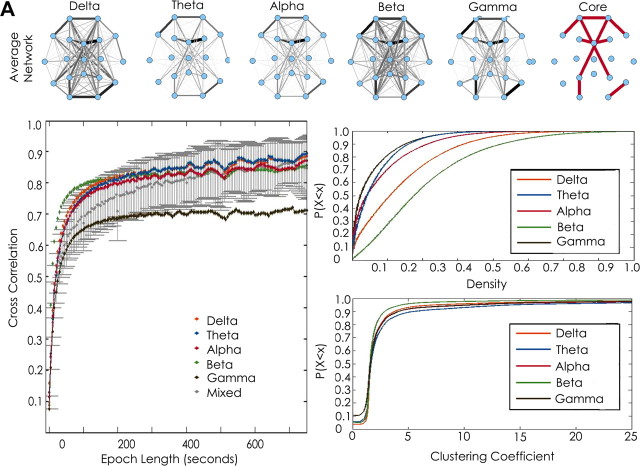
Figure 6.
Functional network stability across frequency bands. A, Average networks derived from the entire recording session in a single subject in each frequency band of interest [delta (0.5–4 Hz), theta (4–8 Hz), alpha (8–12 Hz) beta (12–20 Hz), and gamma (20–50 Hz)]. The widths of the edges are drawn proportional to the frequency with which the edge appears in the sample. Consistent functional network topologies are evident across all frequencies. The most stable edges (those with weights above the 95 percentile) are shown in red. B, Functional network stability is plotted as the average 2D cross-correlation (y-axis) for all networks derived from increasing epoch lengths (x-axis) for each frequency band and mixed frequency bands compared with each other. Networks are highly variable for epochs <20 s but rapidly stabilize with increasing lengths and achieve near-maximal cross-correlation values for epochs >100 s. Similar curves are seen for each frequency band. Networks compared within the same frequency are more similar then networks compared from different frequency bands (plotted in gray). C, Top, Empirical cumulative distribution function of density measures for all 1 s networks for each frequency band and all subjects. Graph characteristics vary significantly between frequency bands (p < 0.0001 for all comparisons). Sparsest networks were seen in the low gamma and theta bands for each subject.

