
Fig. 1.
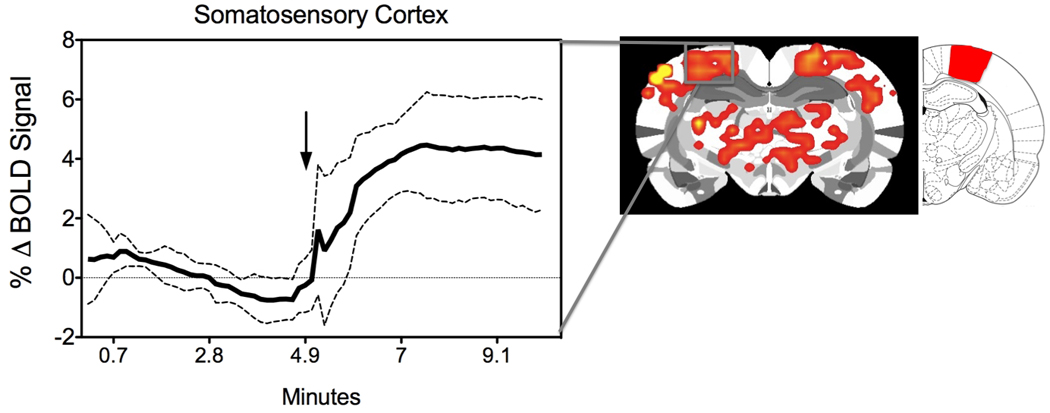
BOLD signal response in the ventrum trunk representation of the somatosensory cortex of awake rats. Seven unanesthetized virgin rats received mechanical rubbing stimulation on the ventrum skin for 5 minutes during a 10-minute fMRI scan (4). Shown is a composite brain image highlighting positive somatosensory BOLD activation. To the right of the brain map is a rat atlas map highlighting the ventrum trunk area. The timecourse to the left shows the temporal evolution of the BOLD signal (mean ± standard deviation). Arrow indicates stimulus onset.