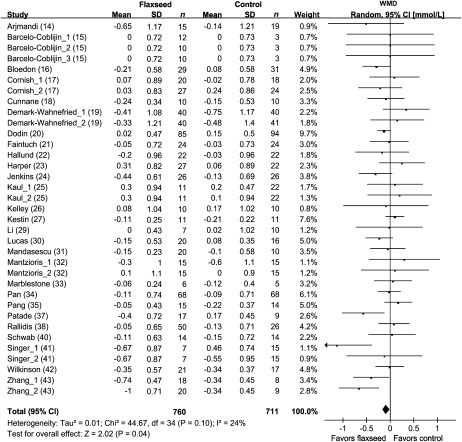
FIGURE 3.
Net changes (95% CI) in LDL cholesterol associated with flaxseed intervention expressed as the change during the intervention with flaxseed or its derivatives minus the change during the control regimens. WMD, weighted mean difference; Random, random-effects model. The horizontal lines denote the 95% CIs, some of which extend beyond the limits of the scales. The square represents the point estimate of each study. The diamond represents the overall pooled estimate of the treatment effect. Overall, LDL cholesterol decreased by 0.08 mmol/L (95% CI: −0.16, 0.00 mmol/L; P = 0.04) in the intervention groups compared with the control arms.

