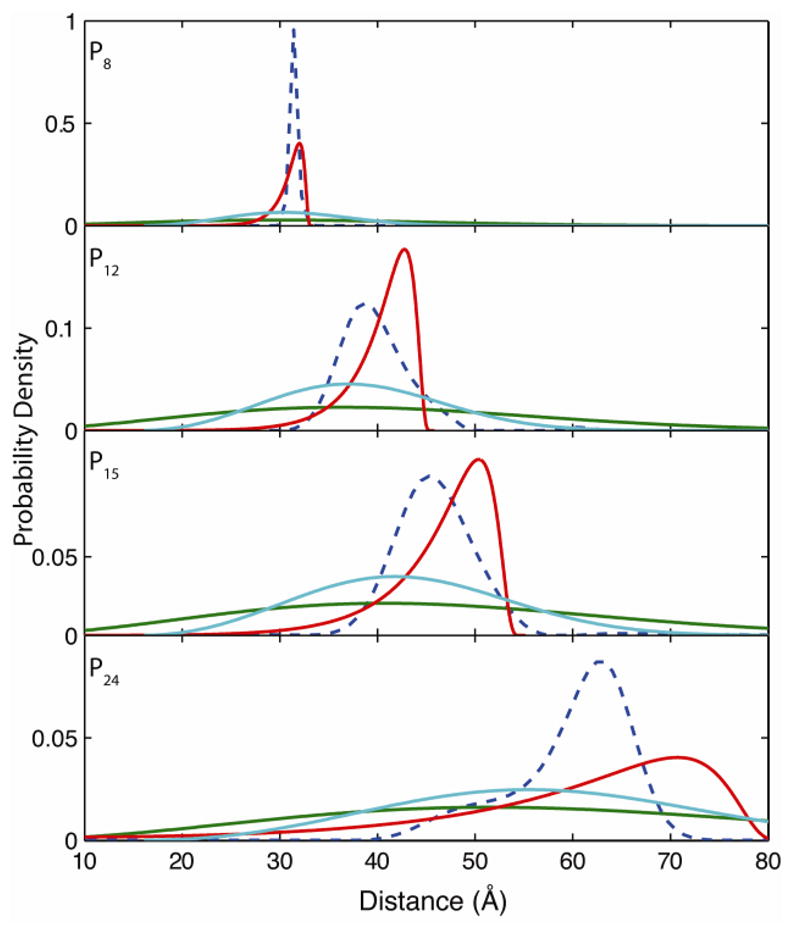
Figure 5.

Distance distribution as an effective measure to discriminate different polymer models. Distance distributions predicted by WLC (red), SAC (light blue), and FJC (green) polymer models using fitting parameters from Figure 4 and compared to experimental PDFs (dashed blue line). All models predict broader distributions than observed experimentally with the FJC and SAC models predicting physically unreasonable distances.
