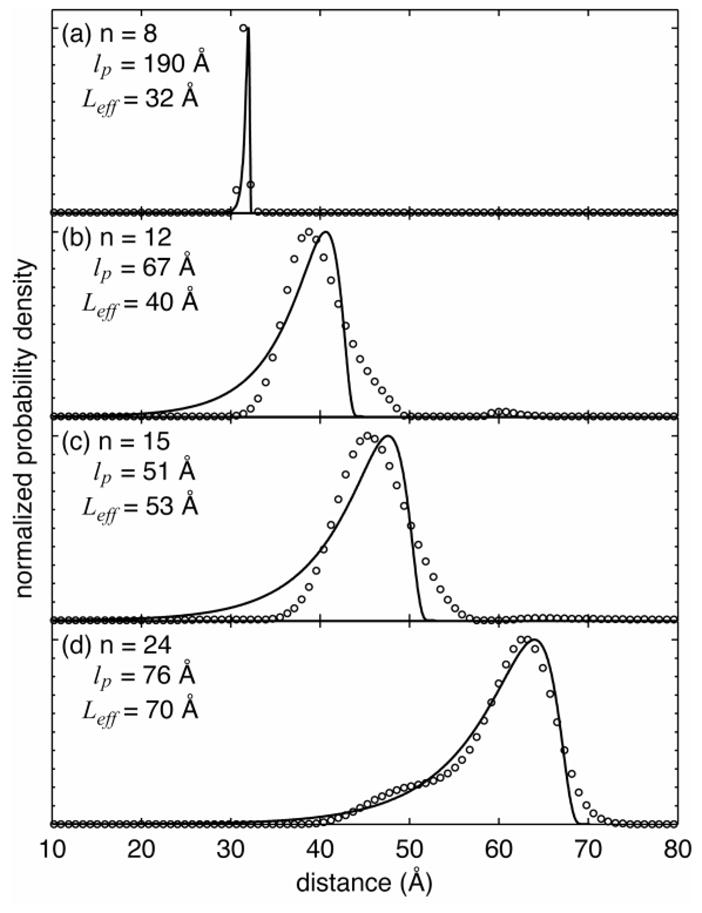
Figure 6.

Chain-length-dependent flexural rigidity revealed by molecular conformation distributions. The open circles are experimental data and the solid lines are fits to the full-width half-maximum of the semi-flexible chain model, from which the effective persistence lengths (lp ) and apparent contour lengths ( Leff ) were estimated.
