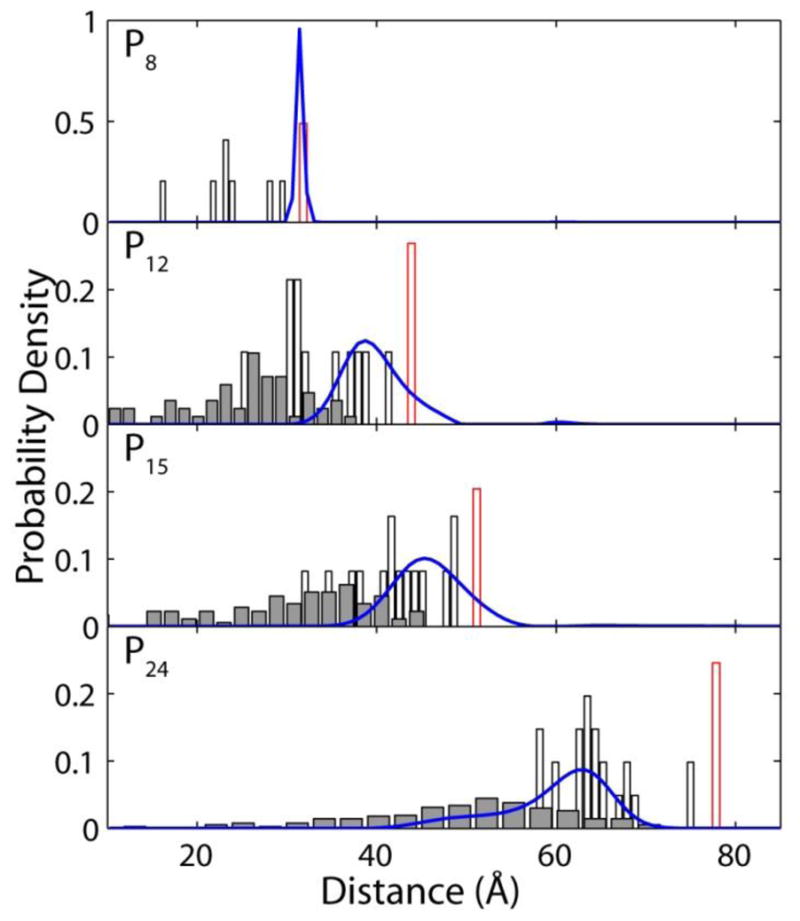
Figure 8.

Single-molecule probability density functions compared with results of molecular dynamics simulations. White bars represent distances predicted from poly-L-proline peptides with a single cis-isomer, red outlines represents the predicted distances for all trans poly-L-proline and grey bars represent simulations with two cis isomers. Additional distance correction was made in addition to the end-to-end proline distance to account for distance added by dye and linkers as discussed in the text. Results emphasize the non-statistical distribution of cis-isomers in short poly-L-proline peptides.
