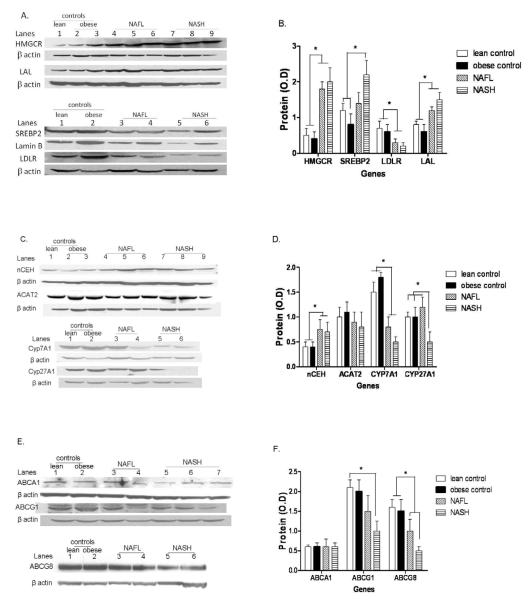
FIGURE 2.
Western blot analysis and graphic summary of protein expression (mean ± S.D.) of HMGCR, LAL, SREBP-2 and LDLR in lean controls, obese controls, NAFL and NASH (panels A and B respectively), nCEH, ACAT2, CYP7A and CYP27A (panels C and D), and ABCA1, ABCG1 and ABCG8 (panels E and F). β-actin was used as a loading control for all except SREBP-2 which was performed on nuclear extracts and where lamin B was used as the loading control. NAFL and NASH were associated with a highly significant increase in HMGCR (* p< 0.0001 for both). SREBP-2 levels were significantly higher in NASH compared to controls (* p< 0.02). LDLR was significantly decreased in both NAFL and NASH (* p< 0.03 for both compared to controls) while LAL was increased (p< 0.02 for both compared to controls). NAFL and NASH were also associated with significantly increased nCEH (* p< 0.01 for both vs. controls) along with decreased expression of CYP7A (* p< 0.05 for both). There was a stepwise decrease in ABCG8 expression from normal to NAFL to NASH (p< 0.05 for NASH vs. lean and obese controls). CYP27A was decreased in NASH alone compared to controls and NAFL (p< 0.02 vs. both controls and NAFL).

