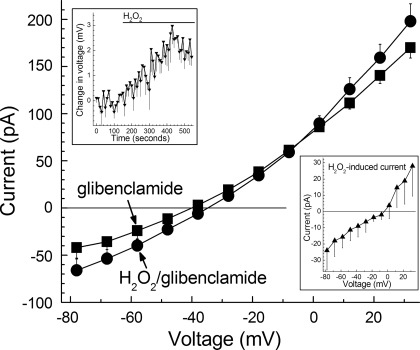
Fig. 4.
Effect of H2O2 on I-V relations recorded in retinal microvascular complexes whose KATP channels were blocked by glibenclamide. I-V relations were determined in solution A supplemented with 0.5 μM glibenclamide (■) and then again 6 ± 1 min after the addition of 15 μM H2O2 (●). I-V plots are the means of 4 experiments. Inset, top: time course for the H2O2-induced depolarization (P < 0.001) of the glibenclamide-treated microvascular complexes whose I-V relations are shown in the main panel. Inset, bottom: I-V relationship of the H2O2-induced conductance determined by calculating the difference in the plots shown in the main panel.

