Figure 2.
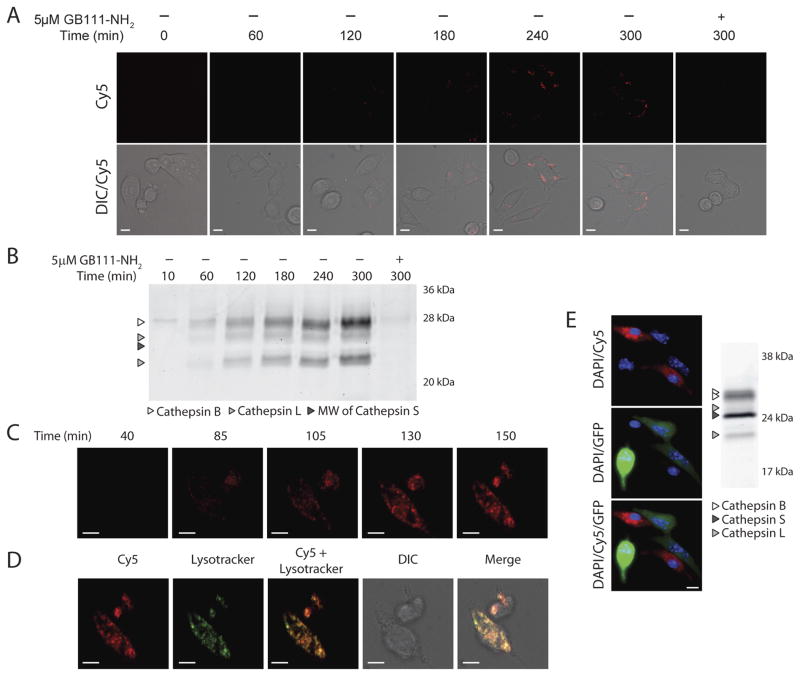
Live cell imaging of probe labeling. A–D) Live cell confocal microscopy time course of BMV083 cysteine cathepsin labeling. A) 4T1-luc-GFP cells were exposed to 1 μM BMV083 and imaged over time. Where indicated cells were preincubated with the cysteine cathepsin inhibitor GB111-NH2 (5 μM) for 1 hr before addition of probe (Scale bar 10μm). B) 4T1-luc-GFP cells were exposed to 1 μM BMV083 and harvested at indicated time points. 40 μg total protein was resolved on 15% SDS-PAGE and fluorescently labeled proteins were visualized by in-gel fluorescence scanning (MW = molecular weight). C) Mouse primary bone-marrow derived macrophages were exposed to 1 μM BMV083 and imaged over time (Scale bar 10μm). D) After final time point lysotracker was added (Scale bar 10μm). E) 4T1-luc-GFP cells and mouse primary bone-marrow derived macrophages (2 to 1 ratio) were co-cultured. After 90 hr the cells were exposed to 1 μM BMV083 for 2 hr. Cells were imaged (Red, Cy5 fluorescence; Green, GFP; Blue, DAPI staining. Scale bar 10μm) and harvested. 40 μg total protein was resolved on 15% SDS-PAGE and fluorescently labeled proteins were visualized by in-gel fluorescence scanning.

