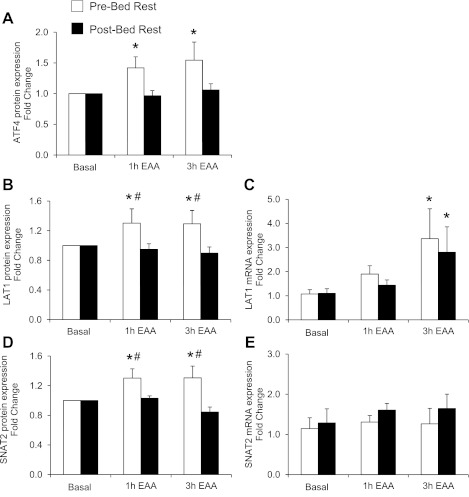
Fig. 5.
Activating transcription factor 4 (ATF4) and amino acid transporters. Data represent ATF4 protein content (A), L-type amino acid transporter 1 (LAT1) protein content (B), LAT1 mRNA expression (C), sodium-coupled neutral amino acid transporter 2 (SNAT2) protein content (D), and SNAT2 mRNA expression (E) in the postabsorptive state (basal) and 1 and 3 h after ingestion of EAA in skeletal muscle of older adults (n = 6). *Different from basal (P < 0.05). #Different from post-bed rest at corresponding time point (P < 0.05). Values are presented as means ± SE.

