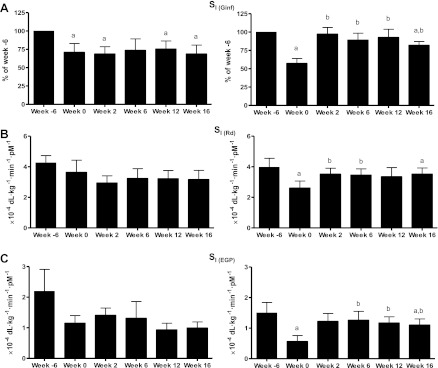
Fig. 3.
Whole body insulin sensitivity (SI; presented as %week −6) (A), peripheral SI (B), and hepatic SI (C). Placebo group is shown at left, and rimonabant-treated animals are shown at right. aP < 0.05 vs. week −6; bP < 0.05 vs. week 0. Ginf, glucose infusion rate; Rd, glucose disappearance; EGP, endogenous glucose production.

