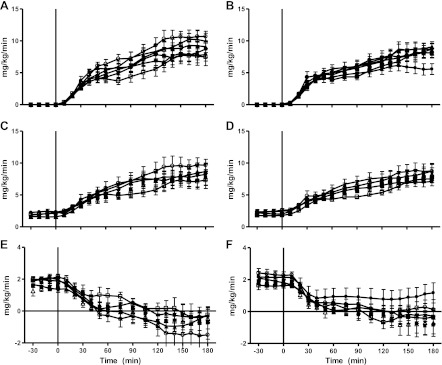
Fig. 4.
Time course data for glucose infusion rates (A and B), glucose uptake (C and D), and EGP (E and F) during the clamp before fat diet (week −6; ○), after fat diet (week 0; ●), and during the treatment period at weeks 2 (□), 6 (■), 12 (▵), and 16 (▴). Placebo group is shown at left, and rimonabant-treated animals are shown at right.

