Fig. 5.
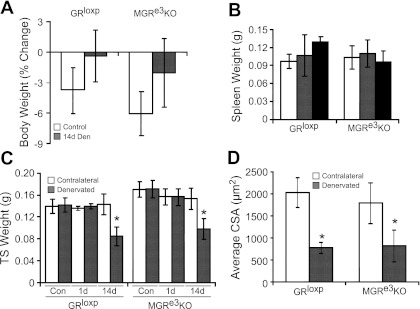
Denervation induces a similar degree of atrophy in both GRloxP and MGRe3KO littermates. A: body weights of GRloxP and MGRe3KO mice before and after 14-day denervation (14d Den). B: spleen weight from control animals (open bars) and 1 (gray bars) and 14 days (black bars) after denervation in GRloxP and MGRe3KO mice. C: wet weight of both contralateral (open bars) and denervated TS muscles (gray bars) at 1 (1d) and 14 days (14d) as well as from control (Con) nondenervated animals. D: average CSA. Values represent 3 animals/treatment group; 5 pictures/gastrocnemius section of each animal were taken at ×20 magnification, and 100–400 myofibers were counted in each picture. Open bars represent contralateral gastrocnemius, and gray bars are 14d denervated gastrocnemius. Error bars represent means ± SD; n = 3 for control groups, and n = 6 for Den groups. *P < 0.05 (vs. control).

