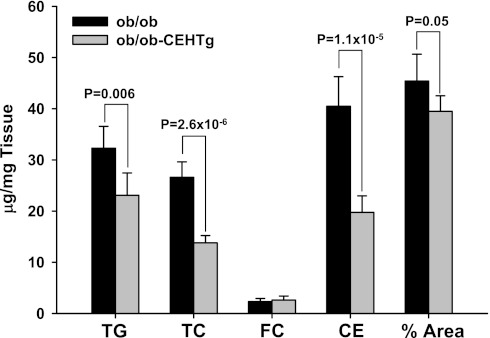
Fig. 3.
Reduced lipid accumulation in ob/ob-CEHTg mice. Biochemical analysis: total lipids were extracted from a known amount of liver tissue (∼100 mg). Triglyceride (TG) content was determined enzymatically, and total cholesterol (TC), free cholesterol (FC), and cholesterol ester (CE) content were determined by gas chromatography. Lipid content was normalized to the weight of liver used and expressed as μg/mg tissue weight. Magnified H & E-stained images (Fig. 2B) were analyzed to determine the %area of the cell occupied by lipid. Data are shown as means ± SD; n = 6, and individual P values for the differences between groups are indicated.

