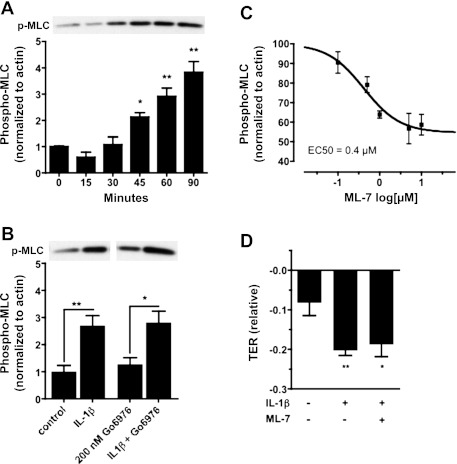
Fig. 5.
Phosphorylation of regulatory myosin light chain (MLC-2) in response to IL-1β treatment in hBMECs. A: Western blot data showing an increase in phosphorylated MLC-2 (p-MLC) over time in response to IL-1β treatment. A representative blot showing increasing p-MLC band intensity after IL-1β exposure is shown at top. Corresponding quantitative data (band intensity normalized to β-actin) are shown at bottom. Statistically significant increases are seen at 45, 60, and 90 min after IL-1β treatment (P < 0.05, 0.01, and 0.01, respectively). B: Western blot data showing increased p-MLC band reactivity at 90 min after IL-1β treatment. Increased p-MLC is not prevented by treatment with 200 nM Gö6976 for 30 min before IL-1β exposure. Corresponding quantitative data (band intensity normalized to β-actin) are shown below (P < 0.01 or 0.05 vs. control, respectively). C: Western blots show dose-dependent inhibition of MLC-2 phosphorylation in response to ML-7 treatment. Data are quantified (normalized to actin) and fit to a sigmoidal dose-response curve (IC50 = 0.4 μM). D: treatment with 5 μM ML-7 for 1 h fails to prevent the IL-1β (100 ng/ml)-induced decrease in TER at 6 h. Mean TER values are significantly decreased following IL-1β treatment in the presence or absence of ML-7 (P < 0.05 or 0.01, respectively) compared with the control condition. Data shown are means ± SE; represents n ≥ 4 independent experiments (*P< 0.05, **P < 0.01).

