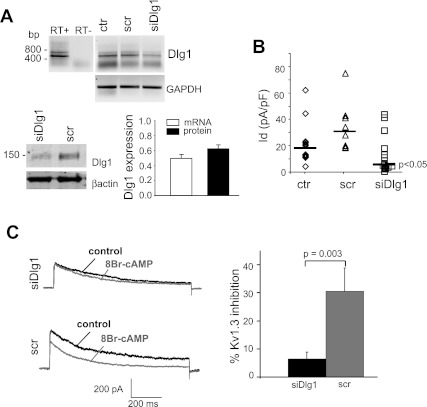
Fig. 5.
PKAI effect on KV1.3 is reduced by Dlg1 downregulation. A: expression of Dlg1 is reduced by Dlg1 siRNAs. Top: RT-PCR amplifies a band of the predicated molecular size for Dlg1 (446 bp) with no genomic contamination (−RT). Representative RT-PCR bands for Dlg1 obtained at a number of cycles before saturation are reported for control cells (ctr, n = 4), and cells after a 48-h transfection with scr RNA (src, n = 2) and Dlg1siRNAs (n = 4). Control cells went through the transfection procedure without any RNAs. Dlg1 protein levels in scr and siDlg1-transfected cells are shown at bottom left. This blot represents 3 separate experiments. Average Dlg1 mRNA band intensity (normalized to GAPDH and reported as relative to control cells) and protein levels (normalized to β-actin and reported as relative to scr) are shown at right. B: KV1.3 current density in ctr and src- and siDlg1-treated cells (n = 19). Individual current densities and the corresponding median (solid line) are reported for ctr (◊) and scr (▵; n = 9)- and siDlg1-transfected cells (□; n = 14). Statistical analysis, performed with one-way ANOVA, showed significant differences between siDlg1 and both scr and ctr but no statistical difference between scr and ctr. C: KV1.3 currents were recorded in Jurkat cells transfected with either siDlg1 or scr. Left: representative traces before and after 8-BrcAMP (1 mM) application are shown. Average KV1.3 inhibition is shown at right (n = 9 for siDlg1 and 5 for scr). All these experiments were performed 48 h after transfection. Currents were elicited by depolarizing pulses to +50 mV from a HP of −80 mV every 30 s.

