
Figure 5.
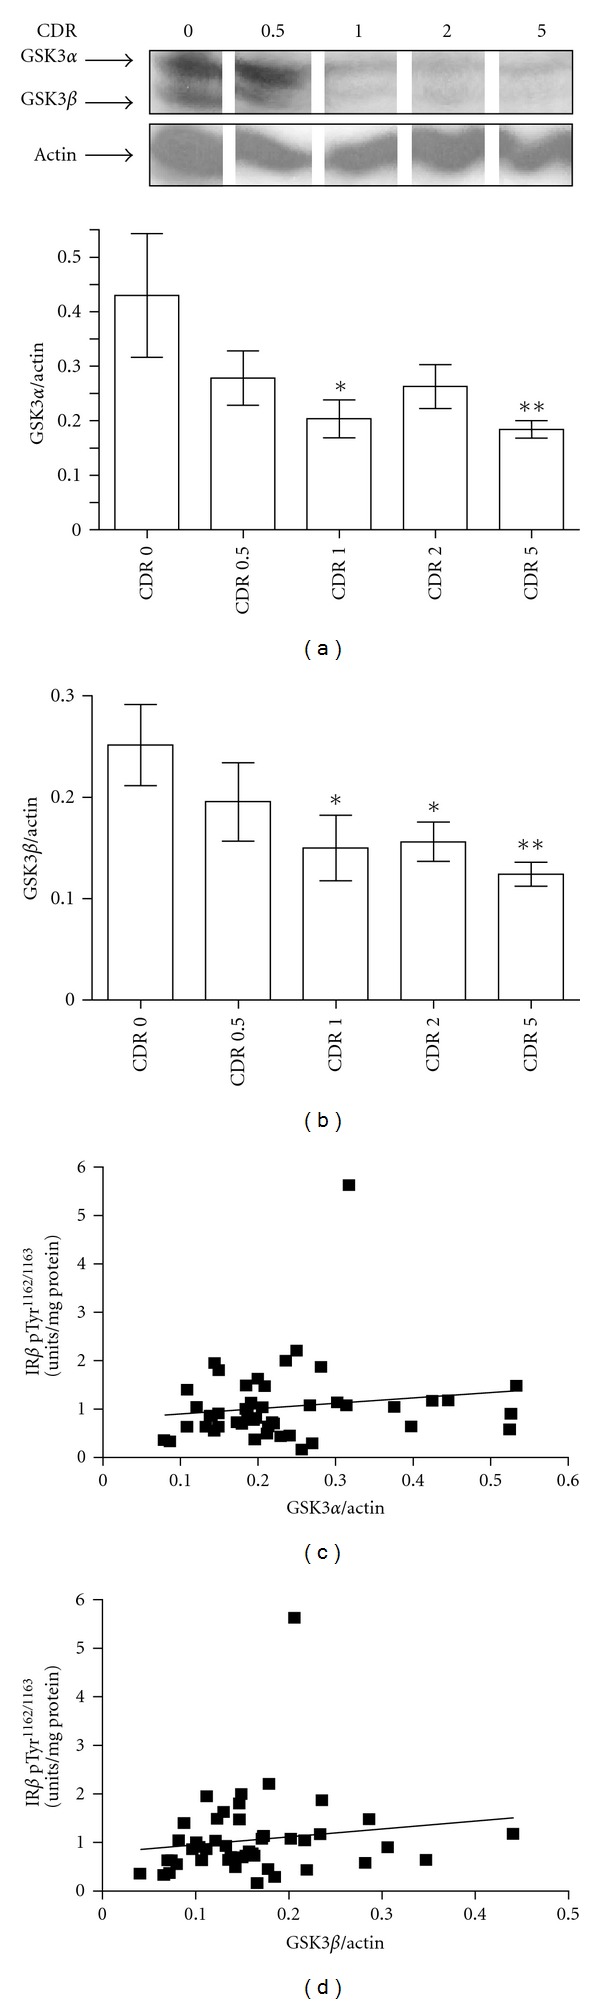
Reduced contents of total GSK3α and GSK3β in the hippocampal formation in AD brain specimens are not correlated with [Tyr1162/1163]-phosphorylated IRβ. Total GSK3α and GSK3β contents in the hippocampal formation were assessed by Western blot analysis. In ((a) and (b)), bar graphs represent mean ± SEM total GSK3α (a) and total GSK3β (b) contents (nonphosphorylated and phosphorylated GSK3 α/β) in the hippocampal formation relative to β-actin as a function of Clinical Dementia Rating. ANOVA; P = .0111 and .0112, respectively, for GSK3α and GSK3β contents among CDR groups. One-tailed t-test in comparison to CDR 0: *P < .05; **P < .005. Inset: representative Western blot analysis of total GSK3α and total GSK3β from CDR 0, 0.5, 1, 2 and 5 hippocampal formation specimens. In ((c) and (d)), correlation analysis of GSK3α (c) and GSK3β (d) contents with respect to [Tyr1162/1163]-phosphorylated IRβ contents in the hippocampal formation. Pearson correlation analysis; P = .318 and .308 for GSK3α and GSK3β contents with contents of [Tyr1162/1163]-phosphorylated IRβ, respectively.