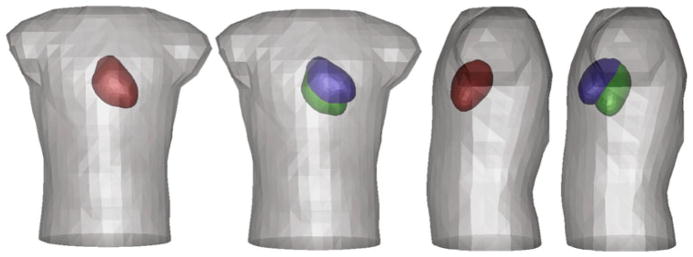
FIGURE 1.
Extremes of motion of the torso tank and cardiac sources. The torso surface is grey and the epicardial surface red in the most central location. The cardiac location extremes are shown in green and blue for a pivoting motion in both x and y directions around a vector centered at the base of the heart.

