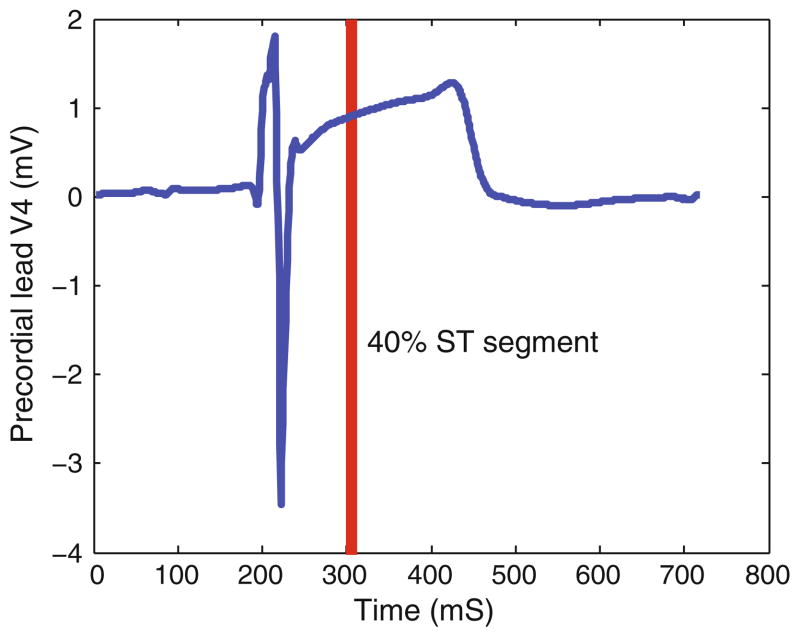
FIGURE 3.
Reconstructed ECG for precordial lead V4. The ECG signal was reconstructed using the BEM from epicardial potentials captured during the late phase of a 180-s episode of elevated heart rate and reduced coronary blood flow. The red line indicates the time of 40% of the ST segment, the time instant used for all subsequent displays of body surface- potential maps below.

