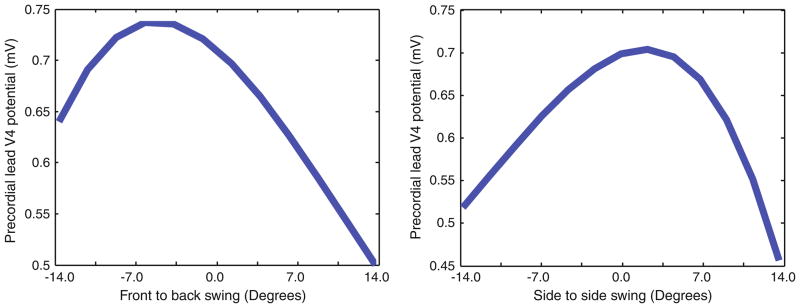
FIGURE 4.
Sampling of the front-to-back swing and the side-to-side swing on the recordings of precordial lead V4. The left figure shows the effects of 20 sample points for front-to-back heart with a maximum value at −6.5°. At right, the figure demonstrates the case of side-to-side cardiac swinging motion. Both figures illustrate the nonlinear nature of the parameter space.

