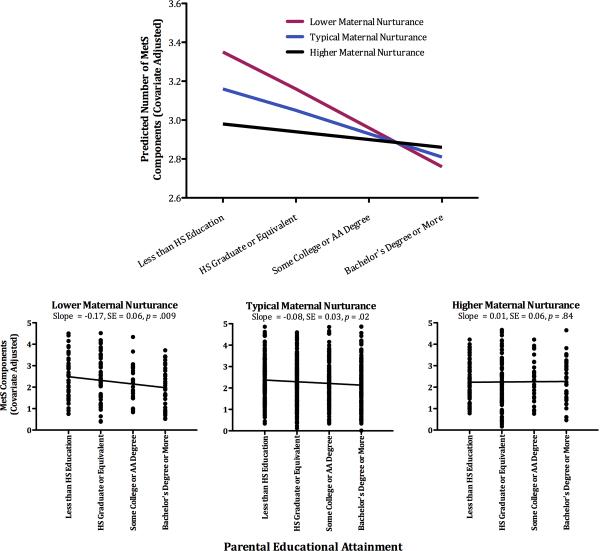
Figure 3.
Maternal nurturance buffers against higher counts of MetS components in those from low-SES backgrounds. The top panel displays adjusted counts of MetS components as a function of childhood SES and maternal nurturance, which is depicted at lower (−1 SD), typical (sample mean), and higher (+1 SD) levels of the sample distribution. The bottom panel displays adjusted counts of MetS components by childhood SES. For illustration, the sample has been stratified into tertiles on maternal nurturance.

