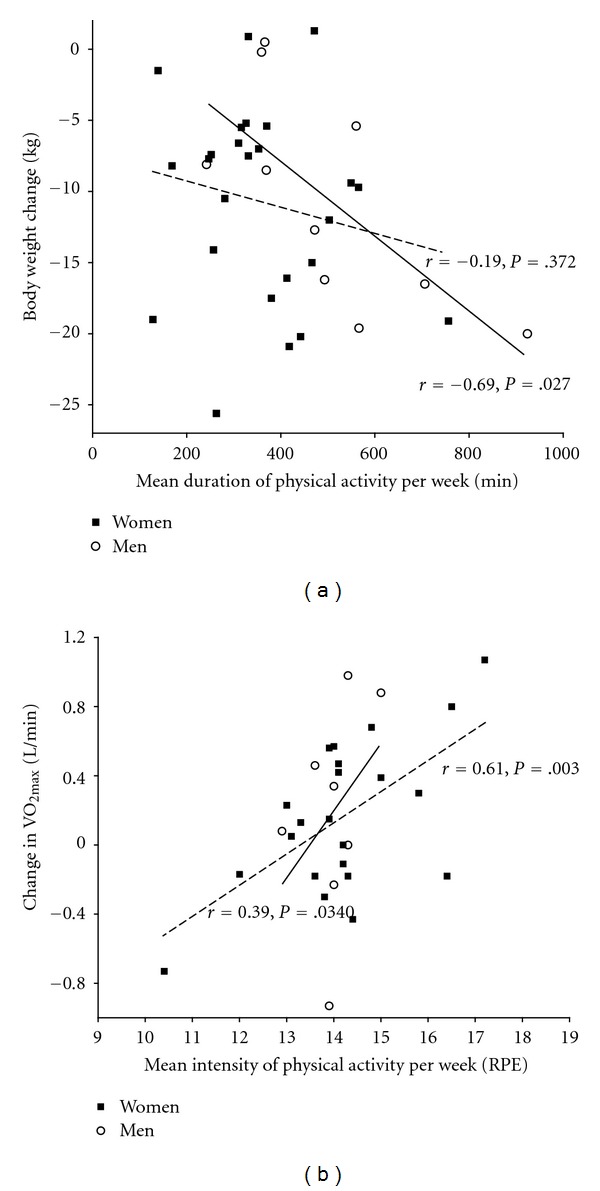
Figure 2.

(a) Scatterplot showing weight change versus duration of physical activity for men (full regression line) and women (dotted regression line). (b) Scatterplot showing change in cardiorespiratory fitness versus intensity of PA for men (full regression line) and women (dotted regression line).
