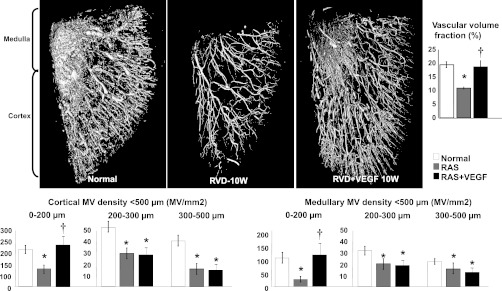
Fig. 2.
Representative 3-dimensional micro-computed tomography (CT) reconstruction and quantification of the cortical and medullary microvascular (MV) density and vascular volume fraction (top) in normal, RAS, and RAS+VEGF kidneys. Intrarenal VEGF administration after 6 wk of RAS led to a significant MV sprouting, reflected in the restored cortical and medullary MV density of microvessels between 0 and 200 μM. Restoration of renal hemodynamics and function (as shown in Table and Fig. 1) supports the notion that these new vessels were also functional. *P < 0.05 vs. normal. †P < 0.05 vs. RAS.

