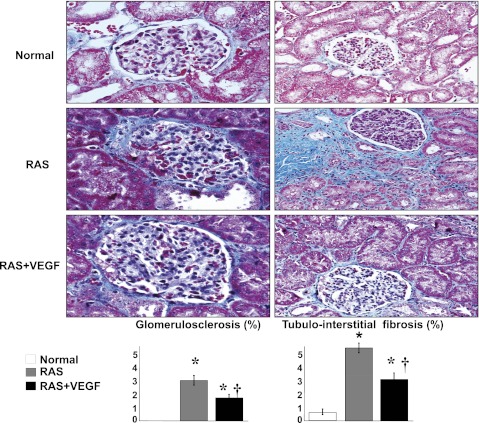
Fig. 5.
Representative glomeruli (×40) and tubulointerstitial region (×20) shown as examples to illustrate fibrosis and quantification in normal, RAS, and RAS+VEGF kidneys. VEGF administration after 6 wk attenuated renal fibrosis, but did not fully reversed renal damage. *P < 0.05 vs. normal. †P < 0.05 vs. RAS.

