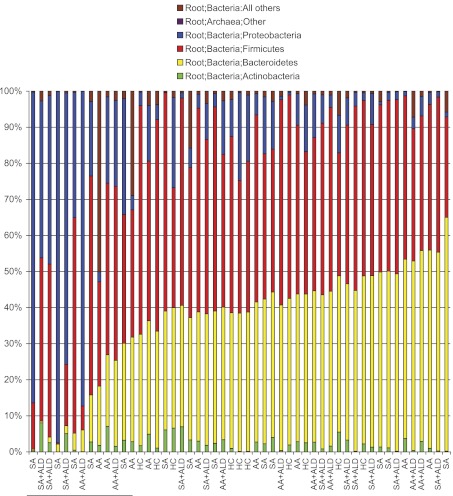
Fig. 11.
Rank order by abundance of the Bacteroidetes phylum. In the stacked histogram, the y axis shows the percent abundance of the 4 most abundant phyla for each study subject and the x axis labels show the group for the study subject. SA denotes a subject who was a sober alcoholic without liver disease; SA + ALD denotes a subject who was a sober alcoholic with liver disease; AA denotes a subject who was an active alcoholic without liver disease; AA + ALD denotes a subject who was an active alcoholic with liver disease. The abundance of the Bacteroidetes phylum in each subject was rank ordered and graphed in order of rising percent abundance. Bacteroidetes is denoted by the yellow portion of the bars for each subject. In this stacked histogram, the other most abundant taxa in each subject are color coded as follow: Actinobacteria phylum (green); Firmicutes phylum (red); Proteobacteria phylum (blue); Archea (pink); and all other sequences (brown). A rise in the Bacteroidetes phylum abundance is seen at about the 30% level. The 13 samples that had the lowest abundance in the Bacteroidetes phylum have been marked at the left lower corner of the graph.

