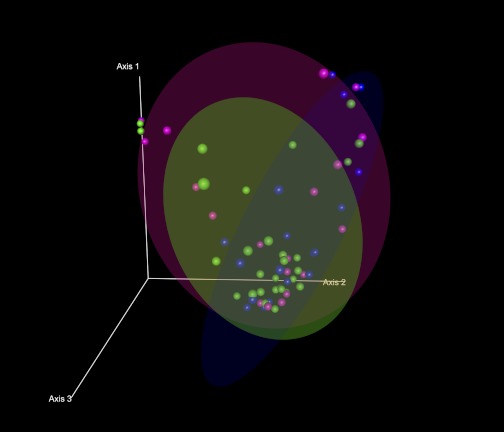
Fig. 2.
Principal coordinate analysis (PCO) plots of the length heterogeneity (LH)-PCR fingerprint abundance data in 3 dimensions. The axes represent the first highest discriminating axes using a Bray Curtis distance measure. HC are depicted as blue. ALC are depicted as green. ALD are depicted as magenta. Each dot corresponds to 1 case. Circles denote the 70% ellipsoid for each group.

