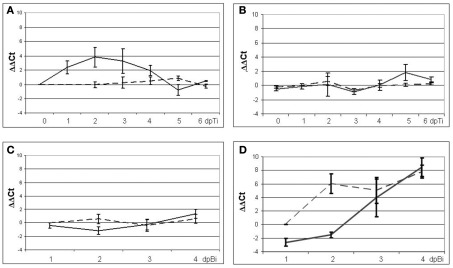
Figure 2.
Analysis of expression of the marker genes PR1 and PDF1.2a in mock-treated control plants (dashed lines) and plants treated with T. hamatum T382 (solid lines) using qRT-PCR. For ISR-prime gene expression analysis of PR1 (A) and PDF1.2a (B) was done in six samples (biological replicates) collected on six consecutive days after T. hamatum T382 administration. For ISR-boost gene expression analysis of PR1 (C) and PDF1.2a (D) was done in five samples (biological replicates) collected on four consecutive days after B. cinerea inoculation.

