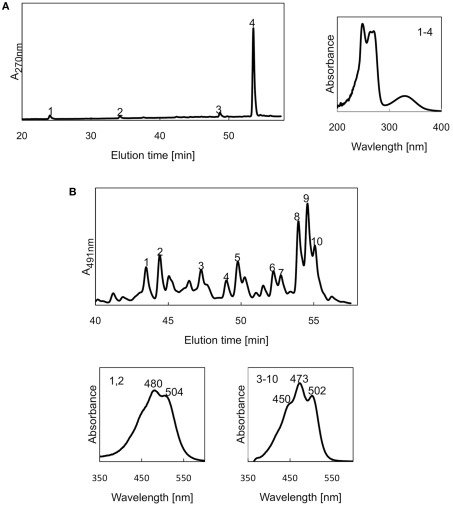
Figure 5.
High-performance liquid chromatography elution profile of pigments produced in I. album. The in-line absorption spectra of the peaks are shown in the numbered boxes. (A) Elution profile monitoring absorbance at 270 nm. Peaks 1–4, menaquinones. (B) Elution profile monitoring absorbance at 491 nm. Peaks 1, 2, deoxyflexixanthin derivatives; peaks 3-10 1′-hydroxytorulene derivatives.

