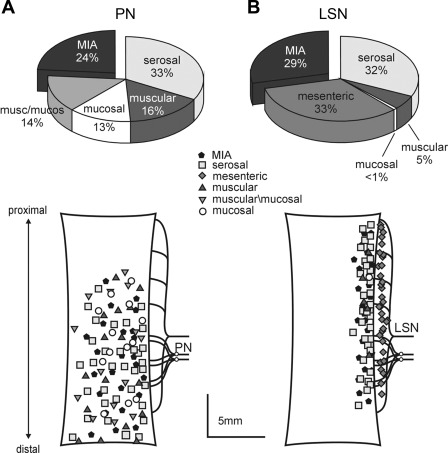
Fig. 2.
Proportions of colorectal afferent classes (top) and topographical distributions of their receptive fields (bottom) in the pelvic nerve (PN; A) and the lumbar splanchnic nerve (LSN) innervations of the mouse colorectum (B). Proportions in the PN were derived from ∼450 and in the LSN from ∼130 single fiber recordings (32, 33). For clarity, topographical distributions reflect locations of different afferent fiber classes of the same number of afferent endings (n = 100) between LS and PN innervations.

