Fig. 5.
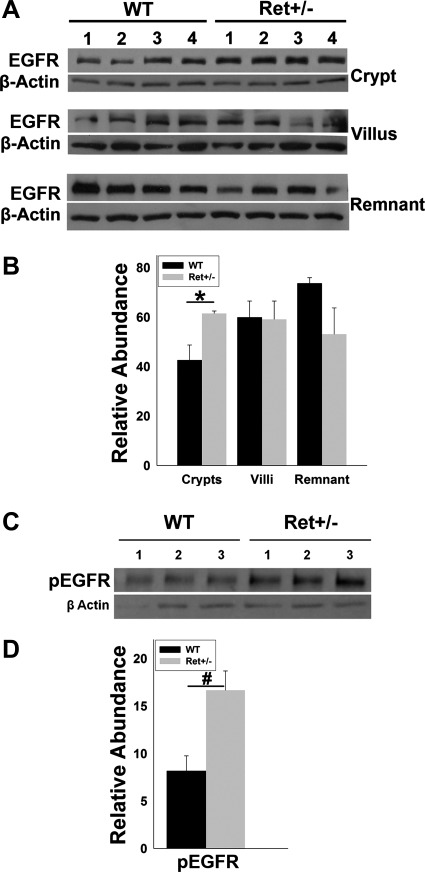
EGFR activation after SBR. A: protein immunoblot for EGFR and β-actin in crypt, villus, and bowel remnant fractions obtained 7 days after SBR from WT and Ret+/− mice. B: quantitative analysis demonstrated elevated EGFR in crypt epithelial cells of Ret+/− mice compared with WT after SBR (normalized to β-actin), but equivalent levels in villus and bowel remnant fractions. C: protein immunoblot of crypt epithelial cells 7 days after SBR shows elevated phosphorylated EGFR (pEGFR) in Ret+/− compared with WT mice. D: quantitative analysis of pEGFR protein levels after SBR. Values are means ± SE. #P = 0.003. *P = 0.03.

