Fig. 4.
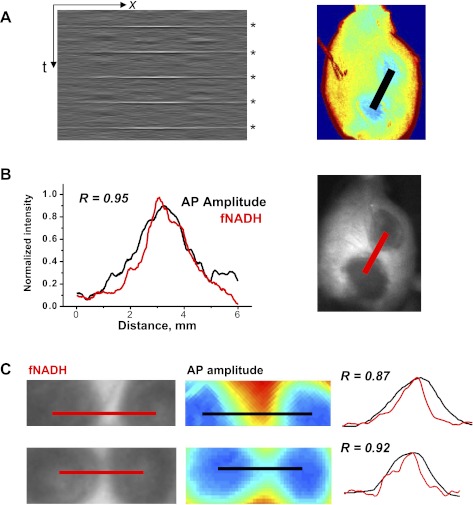
fNADH and electrical activity across the isthmus between two RFA lesions. A: the gray box is an x-t representation of the amplitudes of five sequential action potentials along the black line in the adjacent pseudocolored image. The latter shows the amplitudes of action potentials derived from RH237 data. The x-axis is the distance between the two lesions. The y-axis represents time with action potentials indicated by asterisks on the right. B: the graph shows interlesion intensity profile for fNADH (red line) with the profile of the action potential (AP) amplitude (black line). The two profiles had Pearson's correlation coefficient of r = 0.95, P < 0.001. C: closeup of two other interlesion gaps. Image on the left shows interlesional gap as seen on fNADH channel. The corresponding image on the right is a pseudocolored representation of action potential amplitudes computed from RH237 data. The graph shows normalized intensity profiles for fNADH and action potential amplitudes from corresponding red and black lines. The numbers stands for Pearson's correlation coefficient values.

