Fig. 2.
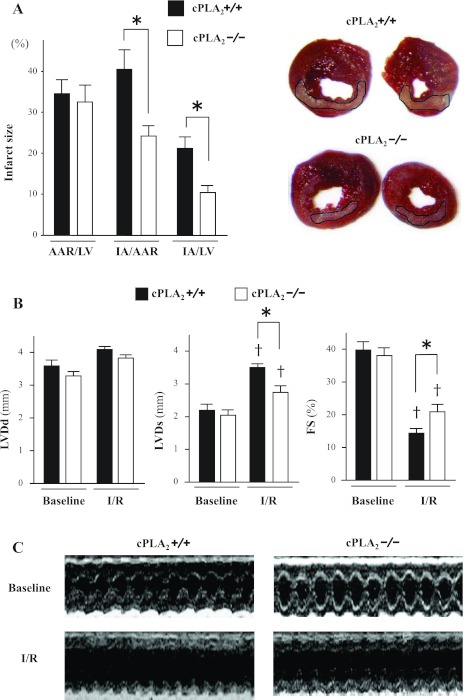
Myocardial infarct size and echocardiography. A: comparison of myocardial infarct size between cPLA2α+/+ mice (filled bars) and cPLA2α−/− mice (open bars). Right, representative photomicrographs of LV sections from cPLA2α+/+ and cPLA2α−/− mice after 1 h of left anterior descending coronary artery (LAD) occlusion followed by 24 h reperfusion (I/R). Viable myocardium is stained red upon reaction with triphenyltetrazolium chloride (TTC). The infarct area (IA), which is demarcated, appears pale due to a lack of TTC staining. These representative sections were fixed in 10% phosphate-buffered formalin after TTC staining to enhance the contrast of the TTC stain. Left, data indicating the area at risk (AAR) as a percentage of LV mass (AAR/LV), IA as a percentage of AAR (IA/AAR), and IA as a percentage of LV mass (IA/LV) in cPLA2α+/+ and cPLA2α−/− mice (n = 12∼14 for each genotype). *P < 0.01. B: in vivo transthoracic echocardiography at baseline and after I/R. M-mode images were obtained for measurement of LV end-diastolic and end-systolic dimensions (LVDd and LVDs, respectively). The fractional shortening (%FS) was calculated as described in the text (n = 10 for each genotype). †P < 0.01 compared with the respective baselines. *P < 0.01. C: representative M-mode images of LV.

