Fig. 4.
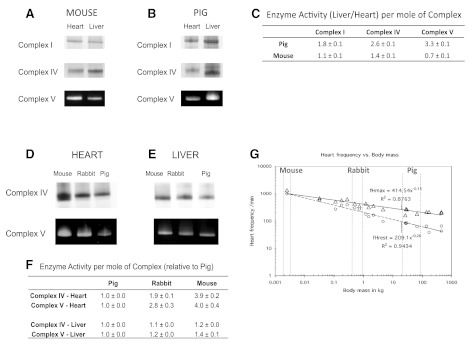
Mitochondrial oxidative phophorylation complex (MOPC) activity in the heart and liver and as an allometric series. BN-PAGE activities of Complexes I, IV, and V in the heart and liver in mouse (A) and pig (B) are shown, where the signal intensity is proportional to Complex activity. C: quantitative liver/heart enzyme activity per mole of Complex (n = 6). Complex IV and V activity as a function of allomtery are shown in the heart (D) and liver (E), with normalized activities referenced to pig (n = 4) (F). G: plot adapted from Hoppeler et al. (36) where the resting (circles) and maximum (triangles) cardiac heart rates are shown as a function of animal size.

