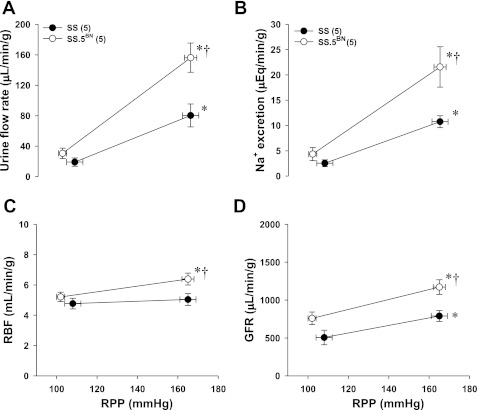
Fig. 7.
Comparison of the changes in urine flow rate (A), Na+ excretion (B), renal blood flow (RBF) (C), and glomerular filtration rate (GFR) (D) in response to elevations in renal perfusion pressure (RPP) in Dahl SS and SS.5BN rats. Values are expressed as means ± SE. *Significant difference from corresponding values in the kidneys perfused at a low RPP (100 mmHg) within the same strain. †Significant difference from corresponding values measured in the SS rats.

