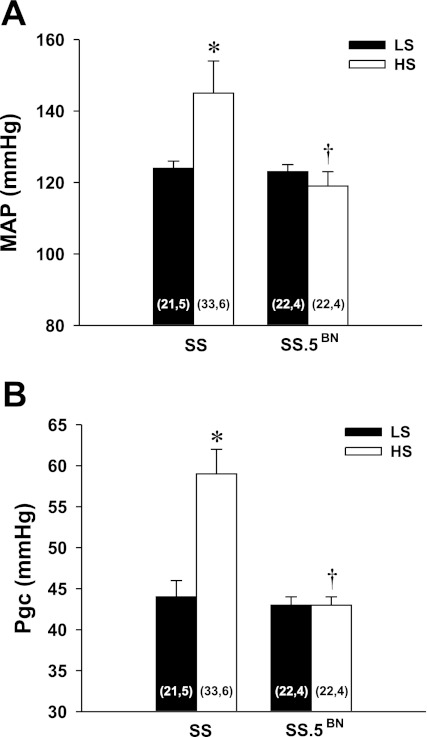
Fig. 8.
Comparison of the measurement of mean arterial pressure (MAP) (A) and glomerular capillary pressure (Pgc) (B) in Dahl SS and SS.5BN rats fed a LS or a HS diet for 14 days. Numbers in the bars indicate the number of glomeruli and rats studied per group. Values are expressed as means ± SE. *Significant difference from the corresponding value in rats fed a LS diet within a strain. †Significant difference from the corresponding value in the SS rats.

