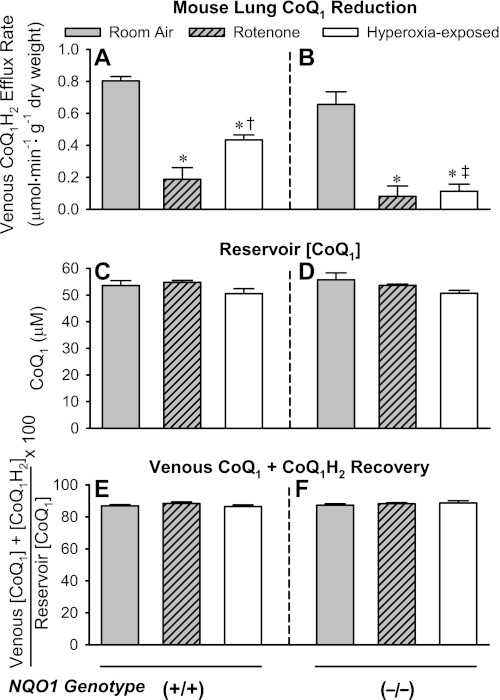
Fig. 2.
Pulmonary venous CoQ1H2 efflux rates when CoQ1 is infused into the pulmonary arterial inflow of NQO1+/+ or NQO1−/− lung and effects of rotenone in the lung perfusate or exposure of the mice to hyperoxia. A and B: CoQ1H2 efflux rates in NQO1+/+ and NQO1−/− lungs. C and D: CoQ1 concentration ([CoQ1]) in the perfusion reservoir (infusion concentration) for NQO1+/+ and NQO1−/− lungs. E and F: percentage of infused CoQ1 that appears as [CoQ1] + CoQ1H2 concentration ([CoQ1H2]) in the venous effluent for NQO1+/+ and NQO1−/− lungs. Values are means ± SE; n = 10 room air-exposed lungs, 4 room air-exposed lungs with rotenone added to the lung perfusate, and 6 hyperoxia-exposed lungs (A, C, and E) and 8 room air-exposed lungs, 4 room air-exposed lungs with rotenone added to the lung perfusate, and 5 hyperoxia-exposed lungs (B, D, and F). Significantly different (by ANOVA and Tukey's honestly significant difference test) within A or within B: *P < 0.05 vs. genotype-matched control room air-exposed lungs; †P < 0.05 vs. genotype-matched rotenone-treated lungs; ‡P < 0.05 vs. hyperoxia-exposed NQO1+/+ lungs. There were no significant differences (ANOVA) between values within any group (C–F) or between groups (C and D or E and F).

