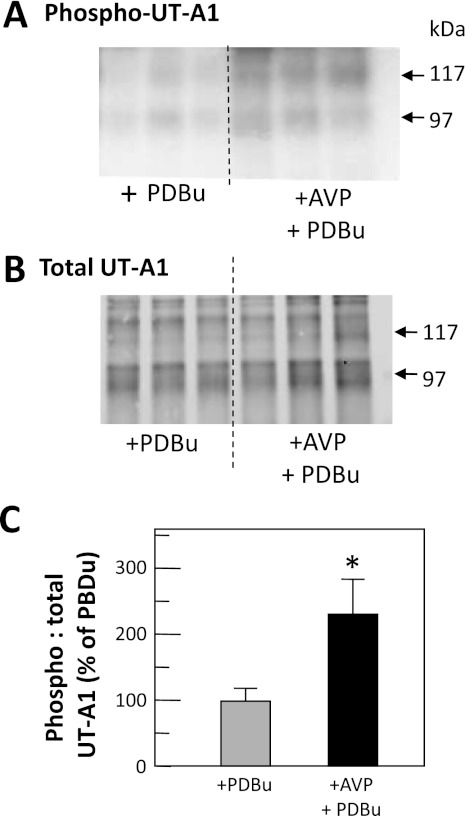
Fig. 5.
Phosphorylation of UT-A1 by PKA+PKC exceeds PKC phosphorylation levels. Metabolically labeled (32P) rat IMCDs were incubated with PDBu or both AVP with PDBu (AVP+PDBu) and then immunoprecipitated with anti-UT-A1 and analyzed by Western blot and autoradiography. A: autoradiogram of 32P-UT-A1. B: Western blot of total UT-A1 for representative samples. Arrows indicate the 117- and 97-kDa glycoprotein forms of UT-A1. C: bar of the ratio of phosphorylated UT-A1 to total UT-A1 from all samples from 3 cohorts of animals, presented as means ± SE, n = 9/condition. *P < 0.05 vs. control.

