Fig. 5.
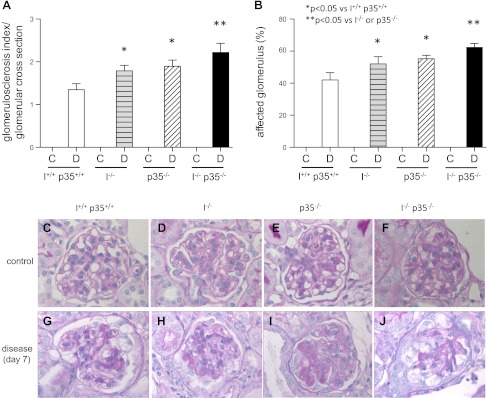
Glomerulosclerosis at baseline and 7 days after disease induction. A: glomerulosclerosis index per glomerular cross section. B: affected glomeruli (%) in nephritic mouse models. At baseline, all groups showed normal glomeruli. Seven days after disease induction, glomerulosclerosis index and affected percentage of all glomerular cross sections increased. *P < 0.05 vs. wild-type. **P < 0.05 vs. cyclin I or p35−/−. C, control; D, disease (day 7). Also shown are Representative images of periodic acid-Schiff (PAS) staining used for scoring. C and G: wild-type. D and H: cyclin I−/−. E and I: p35−/−. F and J: cyclin I−/− p35−/−. C–F: unmanipulated. G–J: glomerulonephritis. Original magnification ×400.

