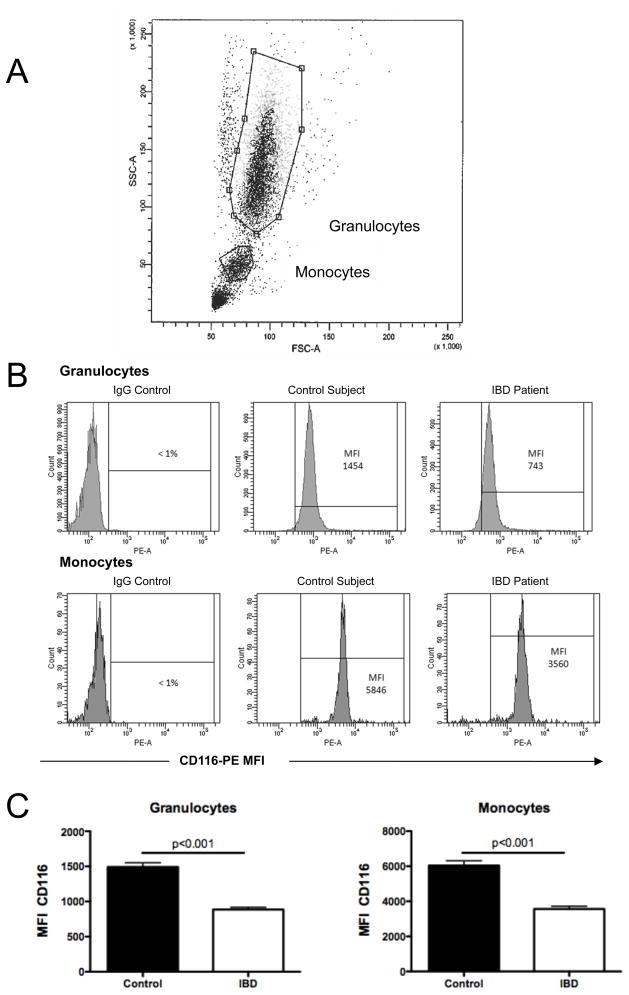
Figure 2. Flow cytometric analysis of CD116 surface expression on healthy and IBD granulocytes and monocytes.
Anti-coagulated whole venous blood was obtained from healthy controls (n=52) and IBD patients (n=52) and used to examine CD116 expression by flow cytometry. Panel A shows an example of the gating strategy used to define granulocytes and monocytes. Panle B depicts representative flow cytometry scattergrams for IgG control and CD116 expression on granulocytes (top panels) and monocytes (bottom panels). Panel C depict expression levels (MFI, mean fluorescence intensity) for granulocytes and monocytes, respectively.

