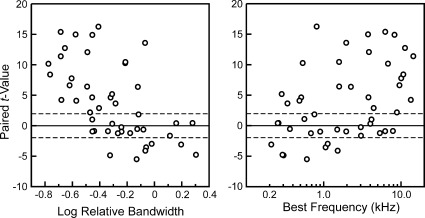
Fig. 5.
Paired t-values plotted as function of log relative excitatory tuning bandwidth (left) and BF (right) of sites under the ΔF = 0.25 octave condition. Points above and below the horizontal dashed lines at critical t-values = ±1.96 represent sites displaying statistically significant differences (α-level = 0.05) between responses to Targets and Distracter-Flanker complexes (paired, nondirectional t-test; df > 125 for all sites).

