Fig. 6.
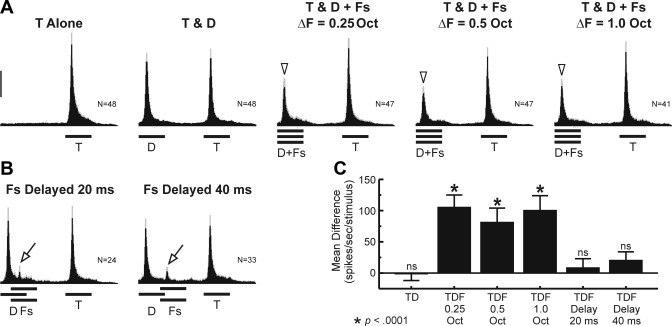
PSTHs of spiking activity evoked by RMR sequences averaged across all sites sampled in the study. A: mean PSTHs under the T Alone, T & D, and T & D + Fs conditions for ΔF = 0.25, 0.5, and 1.0 octaves, as indicated. B: mean PSTHs under the T & D + Fs condition when Flankers are delayed relative to the Distracters by 20 and 40 ms, as indicated. Gray shading above the PSTHs indicates SE. N indicates number of sites contributing to each average. Downward arrowheads indicate attenuated responses to Distracters in the presence of the simultaneous Flankers, compared with responses to the Targets. Response attenuation is not observed when Flankers are delayed by 20 or 40 ms relative to the Distracters. Arrows indicate responses to the delayed flankers. Calibration bar, 100 spikes·s−1·stimulus−1. C: results of paired t-tests comparing peak amplitude of responses to Targets and Distracters in the absence (TD) and presence (TDF) of Flankers, presented simultaneously with the Distracters or delayed by 20 or 40 ms, as indicated below the histograms. Height of bars represents mean difference between Target and Distracter responses; error bars represent SE. Asterisks indicate a significant difference between Target and Distracter responses (for all significant differences, P < 0.0001). ns, Not significant.

