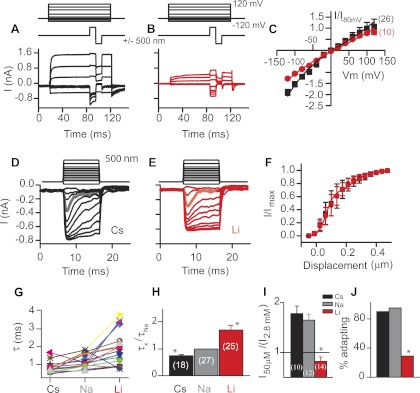
Fig. 4.
Comparisons of molecules with different hydration energies suggest inward current was influenced by hydration whereas outward current was not. A–C: MET currents with either Cs+ (black, A) or Li+ (red, B) as internal and external charge carriers in response to maximal bundle deflections used to generate current-voltage plots (C). Current-voltage plots generated from A and B were fit with the equation for a single-site binding model (n shown in parentheses). Cs+ shows greater inward current than Li+ but no difference in outward current. D–F: mechanical activation curves (stimulus protocol shown at top) for cells with Cs+ (black, D) and Li+ (red, E) as the monovalent ion present extracellularly. Currents are larger and adaptation faster with Cs+ as the charge carrier. Gray trace in D and orange trace in E highlight the change in adaptation rate. Normalized current-displacement plots (F) show no significant difference between Cs+ and Li+ (n = 7 for Li+ and 6 for Cs+). Plots were normalized to account for reduced current with Li+ as the charge carrier. Current-displacement plots were fit to the equation for a double Boltzmann plot. Adaptation time constants (τ) were measured by fitting a single exponential to the current decay in response to a stimulus evoking <50% of the maximal current. Individual cell responses (G) and average values (H) show the time constant varies depending on the monovalent ion present. I: comparisons between different monovalent ions in current amplitude when extracellular Ca2+ was lowered to 50 μM. Values are averages (n shown in parentheses). J: plots of the percentage of cells retaining adaptation when extracellular Ca2+ was lowered for cells with differing extracellular monovalent ions. *P < 0.01.

