Fig. 7.
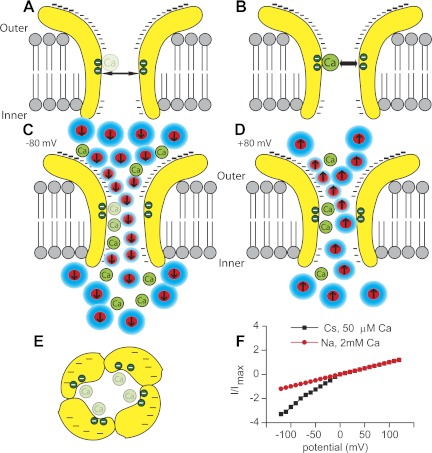
Schematic representation of the MET channel depicts a hypothesis as to how channel rectification occurs and the role of Ca2+ in channel permeation. A illustrates the channel in low external Ca2+ so that the internal Ca2+ binding site is empty and the pore diameter is larger, whereas B presents high external Ca2+ where the binding site is filled, creating a smaller pore diameter. Minus signs indicate electronegativity on the external vestibule. C depicts ion permeation at negative potentials where dehydration (shown as the reduction in water, blue) associated with the ions increases driving force and electrostatic repulsion of Ca2+ from its binding site, whereas D shows permeation at positive potentials where flow is reduced because there is less energy to move Ca2+ from its binding site. E presents a topdown view with the potential binding sites on each subunit shown as the green circles and the electronegative external vestibule depicted by minus signs. The asymmetrical pore is based on the guanidine data. F presents channel rectification under symmetrical ionic conditions (black) compared with previous nonrectified responses under asymmetrical conditions (red). In this depiction, Cs+ is also the internal ion.

