Fig. 2.
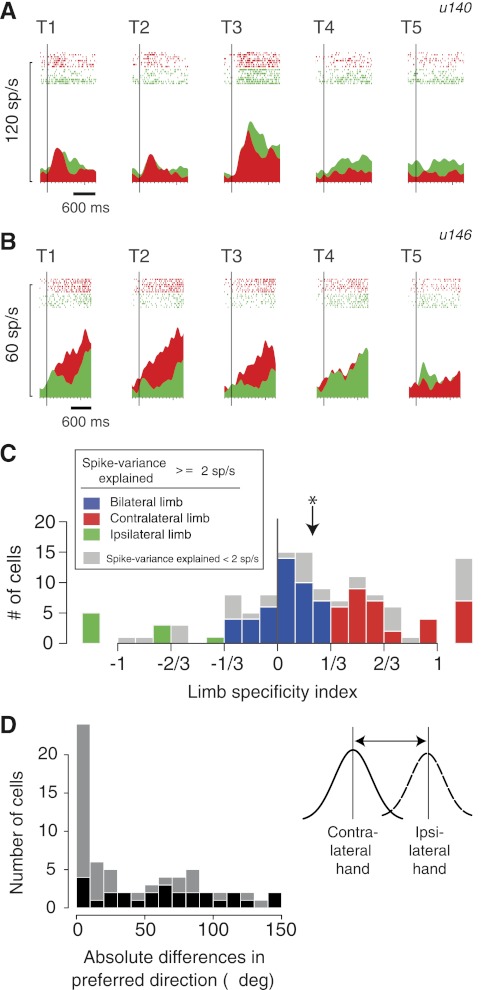
Limb specificity. A: activity (peri-stimulus time histogram and rasters) of an example bilateral-limb cell (u140) in the Aligned condition. The vertical bars show the time of target onset. See Fig. 1A for the location of targets T1–T5. Responses with the ipsilateral limb in green; contralateral limb in red. B: activity of an example contralateral-limb cell (u146) in the Aligned condition. Same format as in A. sp/s, spikes/s. C: histogram of limb specificity indices (contrast ratios) of the entire PRR population during the delay period (n = 125). Cells with at least 2 sp/s spike-variance explained (cells with high variance explained; n = 89; see methods) are color coded according to the limb specificity index (see legend). Cells with <2 sp/s spike-variance explained are shown in gray. Cells with limb specificities >1 or −1 (e.g., 1.23) are shown separately in the margins. Arrow shows the median index, which was significantly greater than 0, indicating a contralateral-limb bias (*P < 0.00001, Wilcoxon signed rank test). D: histogram of absolute preferred direction differences (Δ; in visual angles) for using the contralateral or ipsilateral limb. At the individual cell level, the preferred directions of 27 cells (41%) could be differentiated across the 2 hands (bootstrap test, P < 0.05; shown as dark bars).

