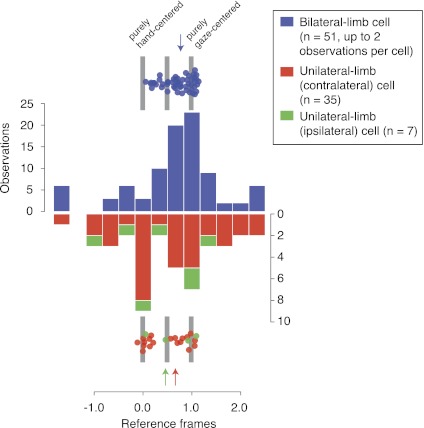
Fig. 5.
Population relationship between reference frames and limb specificities. Distributions of reference frames (frame parameter of the model; Eq. 2) for bilateral-limb cells (both contralateral- and ipsilateral-limb blocks; n = 51; up to 2 observations/cell) and unilateral-limb cells (contralateral-limb cells—data from contralateral-limb blocks only, n = 37; ipsilateral-limb cells—data from ipsilateral-limb blocks only, n = 7; 1 observation/cell for unilateral-limb cells). Color-coded arrows indicate medians for each cell type. Points above and below the histograms show unbinned data points (only the in-bounds cells are shown on these data points). These individual data points are randomly jittered vertically to show overlapping data points.

