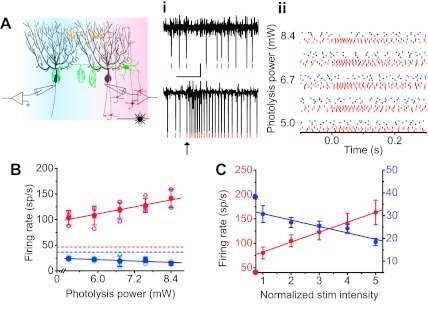
Fig. 1.
Activity of single patches of granule cells can drive the reciprocal firing rates of laterally positioned Purkinje cells. A: direct input from a single patch of granule cells (depicted as red cells) provides net excitation (red zone) to Purkinje cells (depicted in black). Feedforward inhibition by interneurons (green and yellow cells) also allows the same patch of granule cells to inhibit a second group of Purkinje cells (blue zone). i: A pair of Purkinje cells were monitored extracellularly in response to photorelease of glutamate on a single patch of granule cells. ii: Raster plot of the activity of the same 2 cells in response to varying stimulus strengths. B: maximum and minimum instantaneous firing rates (each trial: open circles; mean ± SD: filled circles) of the Purkinje cell pair recorded in A as a function of stimulation strength (photolysis power). Solid line represents the linear regression (red: R = 0.68, P = 0.002; blue: R = −0.41, P = 0.088). Dashed lines: baseline firing rate of each cell = 46.4 sp/s and 36.4 sp/s. C: average (±SE) minimum instantaneous firing rate of all 5 Purkinje cells examined as a function of photolysis power. Solid line represents the linear regression (red: R = 0.99, P < 0.001; blue: R = −0.94, P = 0.018). The position of the symbols on the y-axis indicates the average baseline firing rate of cells receiving excitation (41.9 ± 2.1 sp/s) and inhibition (38.5 ± 0.7 sp/s) (unpaired t-test: P = 0.24).

