Fig. 2.
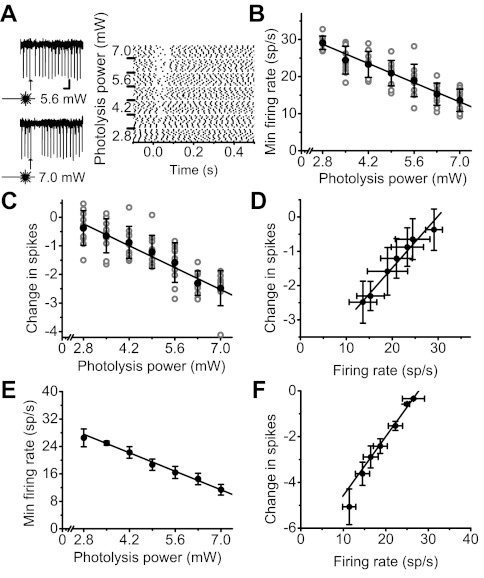
Feedforward inhibition enables Purkinje cells to linearly encode the strength of granule cell inputs in their firing rate. A, left: response of an extracellularly monitored Purkinje cell to photoactivation of a patch of granule cells by glutamate photolysis at 2 different laser powers. The location of the activated patch of granule cells was chosen to inhibit the activity of the target Purkinje cell. Scale bar: 50 ms, 100 μV. Right: raster plot of responses of the same cell to varying stimulation strengths (at t = 0). B: minimum instantaneous firing rate (each trial: gray circles; mean ± SD: black circles) of the Purkinje cell recorded in A as a function of photolysis power. Solid line represents the linear regression. Baseline firing rate = 37.0 sp/s. C: change in the postresponse number of spikes (each trial: gray circles; mean ± SD: black circles) of the Purkinje cell recorded in A as a function of photolysis power. Solid line represents the linear regression. D: reduction in the number of spikes fired by the cell after activation of a patch of granule cells as a linear function of its minimum instantaneous firing rate (mean ± SD). Solid line: linear regression (R = 0.98, P < 0.0001). E: average (±SE) minimum instantaneous firing rate of all 14 Purkinje cells examined as a function of photolysis power. Solid line represents the linear regression. Average baseline firing rate = 40.4 ± 2.1 sp/s. F: average change (n = 14 cells) in the number of spikes fired after stimulus by Purkinje cells as a linear function of the average minimum instantaneous firing rate in the same cells (mean ± SE). Solid line: linear regression (R = 0.98, P < 0.0001).

