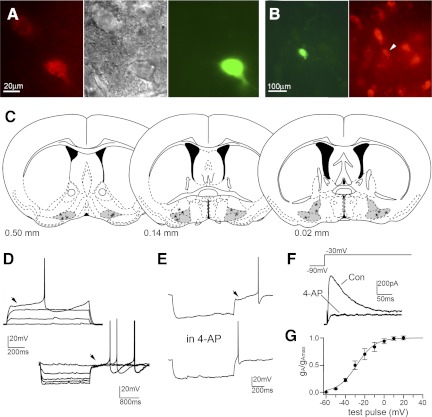
Fig. 2.
A: in vivo labeling of MCPO/SI cholinergic neurons using fluorescent anti-murine p75NTR-IgGs. Two MCPO neurons were labeled with Cy3-p75NTR-IgG (left) and visualized under infrared differential interference contrast (middle), and the lower cell was filled with Lucifer yellow from the recording pipette (right). B: the recorded/Lucifer yellow-filled neuron (in green) is positive for ChAT immunoreactivity (in red). C: coronal diagrams (modified from Franklin and Paxinos 1997) represent the distribution of 17 recorded cholinergic neurons. hDB, MCPO, and SI nuclei are highlighted in gray. The number at the bottom of each diagram indicates mm anterior to bregma. D and E: firing properties of MCPO/SI neurons during depolarizing (+40 pA, from −83 mV; top traces) and hyperpolarizing current pulses (−20 pA, from −50 mV; bottom traces) showing no Ih-mediated depolarizing sag, a voltage-dependent rectification compatible with the presence of an inwardly rectifying K+ current, and delayed rebound firing on recovery from hyperpolarizing pulses due to activation of an A-type current (arrowheads) that is abolished by 5 mM 4-aminopyridine (4-AP). F: voltage-clamp recordings (1 μM TTX) of the A-type current in MCPO/SI cholinergic neurons shown as a transient outward current that is abolished by 4-AP. G: activation curve for A-type conductance (gA; see materials and methods) expressed as a fraction of maximal conductance (gAmax) and plotted against the test pulse potential (holding potential Vh = −90 mV; n = 9). The curve is the best fit of a sigmoidal function (V50 = −28.3 mV and k = 9.59 mV; χ2 < 0.001). Con, control.

