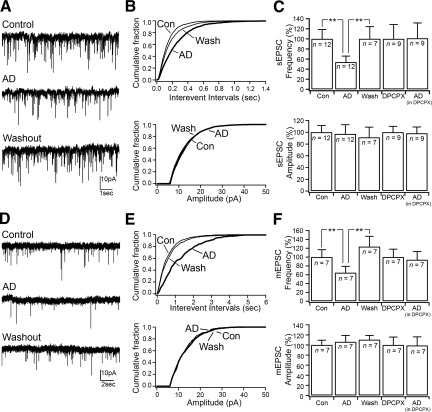
Fig. 4.
Adenosine inhibits spontaneous glutamatergic input through presynaptic A1 receptors. A: effects of adenosine (100 μM) on the glutamatergic spontaneous EPSC (sEPSC). B: cumulative distribution plots of the sEPSC interevent intervals and amplitude (number of sEPSCs: control = 2,118; AD = 1,180; and wash = 1,830) of the cell represented in A. C: bar graphs showing the mean effects of adenosine applied alone and in the presence of DPCPX on sEPSC frequency and amplitude. In control ACSF: adenosine effects on sEPSC frequency [F(6,2) = 6.662, P = 0.011, 1-way ANOVA (**P < 0.01, Fisher's PLSD)] and on sEPSC amplitude [F(6,2) = 1.103, P = 0.363, 1-way ANOVA]. In the presence of DPCPX: adenosine effects on sEPSC frequency [F(8,1) = 0.022, P = 0.886, 1-way ANOVA] and on sEPSC amplitude [F(8,1) = 0.346, P = 0.573, 1-way ANOVA]. D: effects of adenosine on glutamatergic miniature EPSCs (mEPSCs) recorded in TTX (1 μM). E: cumulative distribution plots of mEPSC interevent intervals and amplitude (number of mEPSCs: control = 531; AD = 245; and wash = 432) of the cell represented in D. F: bar graphs showing the mean effects of adenosine applied alone and in the presence of DPCPX on mEPSC frequency and amplitude. In control ACSF: adenosine effects on mEPSC frequency [F(5,2) = 11.157, P = 0.003, 1-way ANOVA (**P < 0.01, Fisher's PLSD)] and on mEPSC amplitude [F(5,2) = 0.901, P = 0.437, 1-way ANOVA]. In the presence of DPCPX: adenosine effects on mEPSC frequency [F(8,1) = 0.022, P = 0.886, 1-way ANOVA] and on sEPSC amplitude [F(6,1) = 0.744, P = 0.421, 1-way ANOVA]. sEPSCs and mEPSCs were recorded at Vh = −70 mV.

